
1 min read
The Value of Monitoring Employee Driving Records
Employees who drive on the job might present some of the highest risks to an organization. In fact, car accidents are the leading cause of workplace...
.svg)
With Verified Credentials' mobile-first candidate experience, you meet candidates where it's most convenient. Learn how easy we make it.
Our new Ban the Box Guide makes it easier than ever to decipher the patchwork of fair chance laws across the country. Check the map to quickly identify what laws apply to you.

Our accreditation confirms that our policies, processes, and employee training meet rigorous industry compliance standards.
5 min read
.png?width=840&height=439&name=Blog%20%20and%20Email%20Images%20%20(25).png)
When considering Continuous Motor Vehicle Record (MVR) monitoring, most employers think of role, not location. While the role is relevant, we decided to evaluate real order data to see if location matters. We analyzed public roadway safety data and stats from:
We found some interesting national driving-record statistics that are worth reading on their own. But based on our proprietary data comparing driving incidents in our sample groups, it turns out that assessing risk by location may be worth considering, too.
This article covers:
Below is a list of the top five culprits of driving incidents based on national crash and behavioral statistics published by the National Highway Traffic Safety Administration (NHTSA), the SambaSafety 2026 Driver Risk Report, and proprietary data.
*** Proprietary data referenced is based on flagged records data from MVR and Continuous MVR incidents spanning from May 2024 to May 2026.
According to the NHTSA’s Motor Vehicle Crash Data Querying and Reporting tool, 9,220,452 drivers were involved in injury-only motor vehicle crashes from 2022 to 2024. As high as that is, a whopping 22,939,472 drivers were involved in property-related motor vehicle incidents from 2022 to 2024.
3,534,509 of these incidents involved a hit and run
2,137,494 involved a large truck
1,800,826 involved speeding
Data filtered by “drivers,” then “all drivers involved in motor vehicle crashes.”
Putting DUIs near the top of the list of the most common driving-related incidents, based on data provided by the NHTSA, is probably no surprise. What may be a surprise is the number of daily casualties it causes nationwide. According to the NHTSA, drunk driving accidents account for about 32 casualties a day.
While drug and alcohol-related driving accidents are common, drug and alcohol testing may not be enough to mitigate liability and driving risks. According to the NHTSA, 3,208 people were killed in motor vehicle crashes by distracted drivers, and over 315,000 were injured in 2024 alone.
Sending a quick text or even talking on the phone while driving can dramatically impact safety and liability. According to the SambaSafety 2026 Driver Risk Report, phone use increases the likelihood of a crash by 240%.
In another study conducted by the NHTSA, 11,248 people were killed in a speeding incident in 2024. Unsurprisingly, speeding was a common violation found in MVR and Continuous MVR incidents in our proprietary data, too.
While it is common, even for safe drivers, to occasionally exceed the speed limit, collecting multiple speeding violations between annual record checks is an indicator of risky and unsafe driving. If left unaddressed, multiple speeding violations can significantly increase insurance premiums, workers’ compensation claims, and the potential for costly property damage.
The top technical violations that were commonly flagged in our proprietary data report were:
While technical violations may not appear immediately dangerous, they can still create significant liability and costs that can quickly add up when paired with an incident. As a key part of the role, or while running a quick, occasional job-related errand, employers are commonly held liable for negligent motor vehicle-related actions, and a lack of compliance with technical requirements can quickly exacerbate costs.
From impaired driving to distracted driving, road safety data can vary from state to state. Especially for roles that cross state lines. Understanding where driving risks are highest can help organizations that are potentially liable for incidents on the road make more informed MVR monitoring decisions, strengthen driver screening programs, and reduce liability exposure.
We looked at our data to provide a breakdown of where we see the most and least hits for Motor Vehicle Report and Continuous MVR searches. We created a Safety Rating Index that considers the number of violations, the total sample group size, and the number of violations per sample group in each state. States are rated on a scale of 1 to 10, with 1 indicating the fewest violations per sample group and 10 indicating the most.
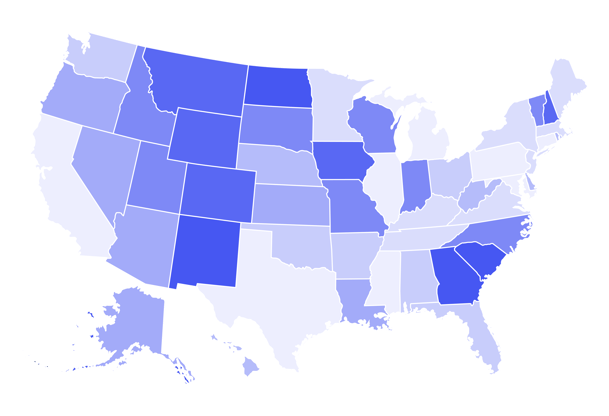
The four states with the highest risk ratings for MVR incidents from May 2024 to May 2026, with a driving violation rate of 9 out of 10 or higher, were:
While speeding was a common violation across many states, our data shows particularly high rates of traffic violations, notably failure to stop at a stop sign and use of a mobile device while operating a vehicle. Other common violations included operating an unregistered vehicle, DUI, failure to appear in court, and driving with a suspended license.
The states and U.S. territories with the lowest risk ratings for MVR incidents, with a driver violation rating of 1.4 or less, were:
*** Proprietary data referenced is based on flagged records from MVR and Continuous MVR incidents between May 2024 and May 2026. This proprietary dataset reflects results from MVR orders placed and may not necessarily represent broader national safety trends.
According to the SambaSafety 2026 Driver Risk Report, while the first six months represent a notably risky period as drivers adjust to new roles and systems, the risk doesn’t decline thereafter. The riskiest period for driving on the job occurs between 24 and 36 months of tenure..png?width=548&height=213&name=Samba%20Safety%20Stat%20(6).png)
Running a Motor Vehicle Record check is a smart first step to make sure that employees who spend time on the road don’t have a history of dangerous driving that puts others on the road and your organization at risk. The problem is that the risk doesn’t stop after hiring, so when safety and organizational liability are on the line, maybe visibility into employee driving behavior shouldn’t stop either.
Whether employees drive every day, travel between locations as part of their job, or run occasional errands, continuous MVR monitoring can help organizations stay informed in real time before dangerous driving becomes a costly, compounding problem. Instead of waiting for periodic checks, quick live updates from continuous monitoring keep employers in the know, so you can do your part to keep roads and people safe and make quick, informed decisions.
It’s that simple. Read more about continuous MVR monitoring here or contact our team to get started.
*** Proprietary data referenced is based on flagged records from MVR and Continuous MVR incidents between May 2024 and May 2026. This proprietary dataset reflects results from MVR orders placed and may not necessarily represent broader national safety trends.
| State | Driving Risk Safety Index |
| New Mexico | 10 |
| Georgia | 9.79 |
| South Carolina | 9.08 |
| North Dakota | 9.02 |
| Colorado | 8.13 |
| Wyoming | 6.89 |
| New Hampshire | 6.83 |
| Iowa | 6.52 |
| Montanna | 5.37 |
| Wisconsin | 5.26 |
| North Carolina | 5.09 |
| Vermont | 4.82 |
| Indiana | 4.77 |
| Utah | 4.42 |
| Missouri | 4.33 |
| Idaho | 4.32 |
| South Dakota | 4.05 |
| Louisiana | 3.38 |
| Arizona | 3.28 |
| Alaska | 3.26 |
| Kansas | 3.07 |
| Oregon | 3.01 |
| Nevada | 2.98 |
| Nebraska | 2.87 |
| West Virginia | 2.79 |
| Rhode Island | 2.76 |
| Delaware | 2.63 |
| Hawaii | 2.48 |
| Oklahoma | 2.39 |
| Florida | 2.39 |
| Ohio | 2.35 |
| Washington | 2.32 |
| Arkansas | 2.3 |
| Alabama | 2.27 |
| New Jersey | 2.15 |
| Tennessee | 2.11 |
| Kentucky | 2.07 |
| Virginia | 2.07 |
| Maine | 2.04 |
| New York | 2.01 |
| Massachusetts | 1.8 |
| Minnesota | 1.75 |
| Texas | 1.52 |
| Maryland | 1.47 |
| Mississippi | 1.47 |
| Illinois | 1.44 |
| California | 1.34 |
| Michigan | 1.33 |
| Connecticut | 1.12 |
| DC | 1 |
| Pennsylvania | 1 |
-Oct-07-2024-05-26-14-0406-PM.png)
1 min read
Employees who drive on the job might present some of the highest risks to an organization. In fact, car accidents are the leading cause of workplace...

1 min read
Ensuring the integrity of your manufacturing supply chain is important for safe and efficient operations. Your number one resource on your line is...

1 min read
Remote work continues to be common throughout the United States. But return to office (RTO) mandates have increased, and with that, the country is...